
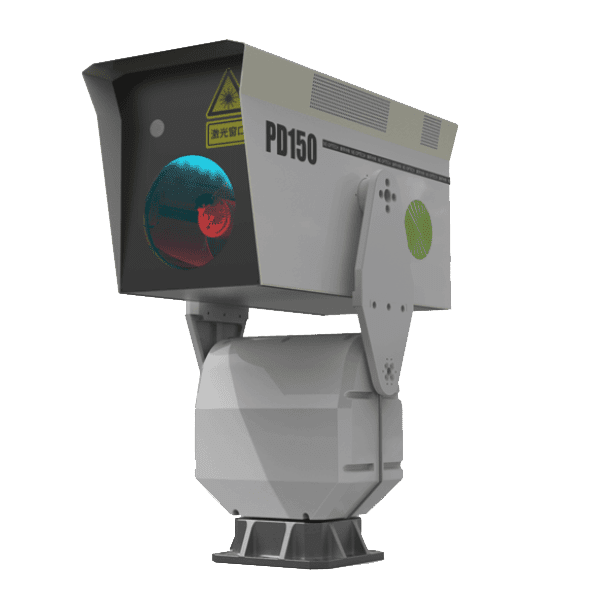
3D Particulate Matters Detection LiDAR - PD150
PD150 portable particulate matter lidar is a portable lidar system , which can achieve 3D scanning, real-time monitoring, and full-automatic operation for 3D monitoring of atmospheric particulate matter. This product can complement the advantages of horizontal scanning, mobile observation, and fixed-point observation to achieve real-time monitoring of the impact range and diffusion direction of pollution discharge, as well as the distribution and transmission of regional particulate matter pollution.
Key Features:
- Long distance: typical horizontal detection distance of 6km, with a maximum of 15km, and typical vertical de-tection distance of 9km, with a maximum of 15km;
- Fine: fine measurement of 3D aerosol distribution, effective and precise detection within the compartment;
- High precision: range resolution of 3m, and temporal resolution of 1s;
- Rich detection methods: PPI scanning, mobile detection, THI detection, etc.;
- Diverse measurement settings: minimum range resolution of 3m (adjustable), minimum integration time of 1s (adjustable), and adjustable laser energy;
- Flexible data acquisition: multiple data output forms, supporting real-time data output, remote wireless moni-toring and data extraction;
- Safety in use: equipped with the functions of GPS position reporting and geo-fencing, as well as data encryption, without risk of leakage;
- All-weather: work double tides, long-term outdoor work, waterproof and antifreeze.
Specifications
Basic functions: | |
Detection distance (typical value) | Horizontal distance of 6km, with a maximum of 15km Vertical distance of 9km, with a maximum of 15km |
Range resolution | 3m or its integer multiple |
Unmeasurable distance | <20m |
Accumulation time | 1s or its integer multiple |
Laser safety class | Class IV |
Horizontal scanning range (azimuth angle coverage) | 0~360° |
Vertical scanning range (pitch angle coverage) | 0~90° |
Angular resolution | 0.1° |
Pointing accuracy | 0.1° |
Detection mode | The following five scanning modes are supported: PPI – constant pitch angle; RHI – constant azimuth angle; THI – vertical observation; CAPPI – adjustable pitch angle; MO – mobile monitoring; Programming scanning mode (user-defined) |
Data | PM2.5, PM10, extinction coefficient, backscattering coefficient, optical thickness, visibility, boundary layer height, depolarization ratio, pollutant type, signal-to-noise ratio, attenuation scattering coefficient, azimuth angle value, pitch angle value, scanning mode, longitude and latitude, ground temperature and humidity, pressure, equipment operation information, etc. |
Power supply and size weight requirements: | |
Operating power consumption | Within 200W at normal temperature and 400W at extreme temperature |
Supply voltage and frequency | 220VAC±20%, 50Hz±10% |
Dimension | 643mm * 250mm * 350mm (excluding PTZ) |
Weight | ≤25kg (excluding PTZ) |
Click HERE to download the detailed Specification for PD150.
Dection Mode - PD150 particulate matter liDAR
PP1 Scanning
PPI stands for Plan Position Indicator. The center point is the lidar antenna, which displays the distance and echo in-tensity of the target object when scanning at a constant pitch angle and azimuth angle for one cycle or a specific angle. It is commonly used in various lidar displays in the fields of air traffic control, marine navigation, and meteorology.

CAPPI scanning
CAPPI stands for Constant Altitude Plan Position Indicator, which is a variant of PPI that uses PPI data from multiple pitch angles to obtain horizontal cross-section echo data at the same altitude. It is commonly used in meteorological lidar.

RHI scanning
RHI stands for Range Height Indicator, which is used to obtain the target distance and echo intensity under the constant azimuth angle and pitch angle scanning, and display them.

THI detection
THI stands for Time Height Indication, which can carry out continuous observation in the vertical direction at fixed points. Through long-term continuous observation, the continuous change of aerosols from surface to high altitude in the area, and the fluctuation of the boundary layer can be obtained.

Mobile observation
Mobile Observation, based on the vehicle-mounted lidar system, can not only quickly detect the source, spatial distribution, transmission path, and sudden events of atmospheric particulate matter, but also has high spatial resolution. Therefore, it can be an effective supplement to ground-based, airborne, and spaceborne lidar detection, achieving 3D detection of particulate matter within the area.

Applications of 3D Particulate Matters Detection LiDAR
Air quality monitoring field
The air pollution in Chinese cities is mainly caused by bituminous coal from industrial enterprises, heating boilers, transportation, etc. In accordance with China’s relevant environmental laws and regulations, although most polluting enterprises have installed online monitoring equipment as required to monitor the concentration of pollution discharge, there are still problems such as pollution sources being geographically dispersed and some enterprises not installing monitoring equipment for stealing discharge at night. Air quality monitoring sites based on ground-based remote sensing technology can measure the continuous point source particulate matter concentration, but the number of sites is limited and regional representativeness is poor. Lidar technology is a new active remote sensing tool for detecting atmospheric particulate matter. Portable particulate matter lidar has the advantages of wide range, high precision, and stable performance in the air quality monitoring field, making it more suitable for long-term and unmanned monitoring. PD150 lidar can use vertical and horizontal scanning observation methods to detect the atmosphere, monitoring the large-scale pollution areas.


The key focus of the portable particulate matter lidar results is:
1. Extinction coefficient:
The aerosol extinction coefficient reflects the atmospheric extinction characteristics. Generally speaking, the higher the pollution concentration in an area is, the greater the extinction coefficient will be, and the lower the visibility will be.
In general, the extinction coefficient of cloud is greater than that of aerosols and dust.
2. Depolarization ratio:
(1) Automobile exhaust and industrial waste gas are mainly acidic spherical particulate matters, with a low depolarization ratio, generally less than 0.1;
(2) Sand and dust are typical non-spherical coarse particulate matters, with a relatively large depolarization ratio, generally between 0.15 and 0.4;
(3) Cirrus cloud has a large depolarization ratio, generally around 0.5, resulting in more scattered results, which is related to the internal structure of the cloud;
(4) For spherical targets, the depolarization ratio is close to 0. The higher the non sphericity is, the greater the depolarization ratio will be.
Mobile monitoring field
The vehicle-mounted 3D particulate matter lidar can achieve mobile detection on the ground, making it suitable for monitoring air pollution in cities. At first, vehicles were only the carrier of vehicle-mounted lidar, transporting lidar from one place to another. After the vehicle stopped, lidar began to detect. With the advances in technology, the current vehicle-mounted lidar operates in a mobile mode, which involves detecting while moving, and can also perform scanning detection.
The mobile detection of our PD150 lidar in Gaochun District, Nanjing City is as follows.


On the afternoon of December 11 at 15:11, the product departed from the Gaochun Ecological Environment Bureau and finally returned to the Gaochun Ecological Environment Bureau through areas such as Kangle Road, Zhenxing Road, Gucheng Hubei Road, and Baota Road, From the 2D and 3D changes, it can be seen that the cloud height on that day was about 2.6km, and the boundary layer height was about 1km. Most aerosols were concentrated below the boundary layer, with a more significant concentration below 500m. During the mobile detection from 16:01 to 16:52, the extinction coefficient was relatively high. Based on the eepolarization ratio, there were mainly fine particulate matters, which were concentrated near Shuanghu Road, Shuanghu South Road, Shuiyangjiang Road, Beiling Road, and Shijiu Hubei Road.
From the 2D and 3D changes, it can be seen that the cloud height on that day was about 2.6km, and the boundary layer height was about 1km. Most aerosols were concentrated below the boundary layer, with a more significant concentration below 500m. During the mobile detection from 16:01 to 16:52, the extinction coefficient was relatively high. Based on the depolarization ratio, there were mainly fine particulate matters, which were concentrated near Shuanghu Road, Shuanghu South Road, Shuiyangjiang Road, Beiling Road, and Shijiu Hubei Road


Figure above shows the variation curve of PM2.5 mass concentration near the ground during mobile detection. It can be seen from Figures 18 and 19 that the PM2.5 mass concentration near the ground varies in the range of 60-140, with an average value of 97. The main high concentration time period is from 16:01 to 16:52, and the PM2.5 mass concentration reaches 100/or above near Shuanghu Road, Shuanghu South Road, Shuiyangjiang Road, Beiling Road, and Shijiu Hubei Road.
Meteorological research field
Climate effects of aerosols
The impact of aerosols on the Earth-atmosphere system can be divided into direct and indirect effects. The direct effect affects the radiation balance of the Earth-atmosphere system by scattering and absorbing solar radiation. The indirect effect means aerosols affect the water cycle of the Earth as condensation nuclei, leading to cloud induced rainfall. Due to the diverse physicochemical properties and distribution of aerosols, there is still some controversy over their impact on the Earth-atmosphere system. In addition, aerosol characteristics are still input or output parameters for forecasting models, and there is an urgent need to verify them with measured aerosol data.
Environmental effects of aerosols
As the society pays more and more attention to environmental issues, there is an urgent need to observe and predict particulate matters, while lidar is the only instrument capable of observing aerosol profiles, and its data can be used to study the discharge flux, diffusion, and transportation processes of aerosols. It has great significance for prediction models and the control of environmental particulate matter pollution.


Figures above shows the high-altitude detection processes of portable particulate matter lidar, including cloud water depolarization, aerosol depolarization, atmospheric aerosol extinction, atmospheric background extinction, cloud extinction, boundary layer height, and other results, which can provide corresponding atmospheric optical elements for meteorological researchers.


